AI 卡片製作器

將文章和筆記轉化為可分享的圖片卡片系列。

社群展示

使用此工具創作的真實成果。

retro style illustration, timeline layout, amber and dark brown palette colors. The card image shows two vintage 1960s computers connected by wires at UCLA and Stanford, a screen displaying 'LO' from a crashed 'LOGIN' message, timeline arrow pointing to 1969 milestone, with title text '1969: ARPANET' and key point 'First computers communicate; networking era begins' rendered prominently in retro typographyretro style illustration, timeline layout, amber and dark brown palette colors. The card image shows interconnected computers speaking a universal protocol language with speech bubbles and network nodes linking globally, timeline arrow at 1983, with title text '1983: TCP/IP' and key point 'Common language for all computers to connect' rendered prominently in retro typographyretro style illustration, timeline layout, amber and dark brown palette colors. The card image shows Tim Berners-Lee at a desk with early computer displaying the first webpage at CERN, hyperlinks and web icons emerging, timeline marker at 1991, with title text '1991: World Wide Web' and key point 'Tim Berners-Lee publishes first website' rendered prominently in retro typographyretro style illustration, timeline layout, amber and dark brown palette colors. The card image shows a simple search engine interface with Stanford logo transforming into the Google brand, people navigating vast info libraries, timeline at 1998, with title text '1998: Google' and key point 'Revolutionizes information navigation' rendered prominently in retro typography
GPT Image 2

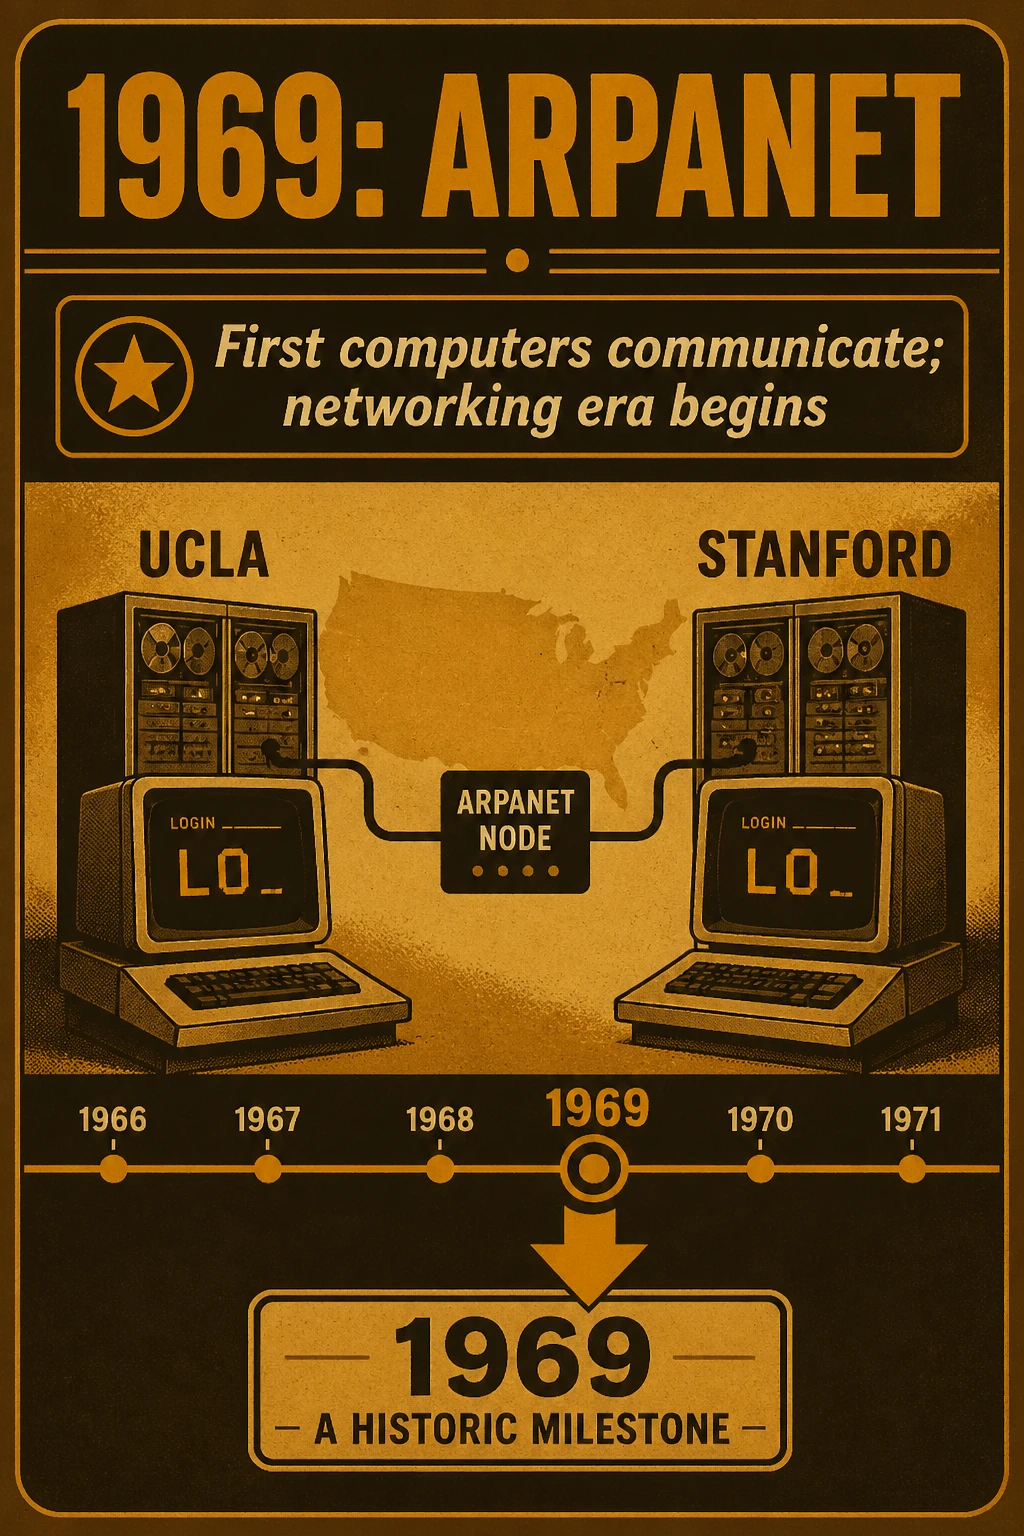
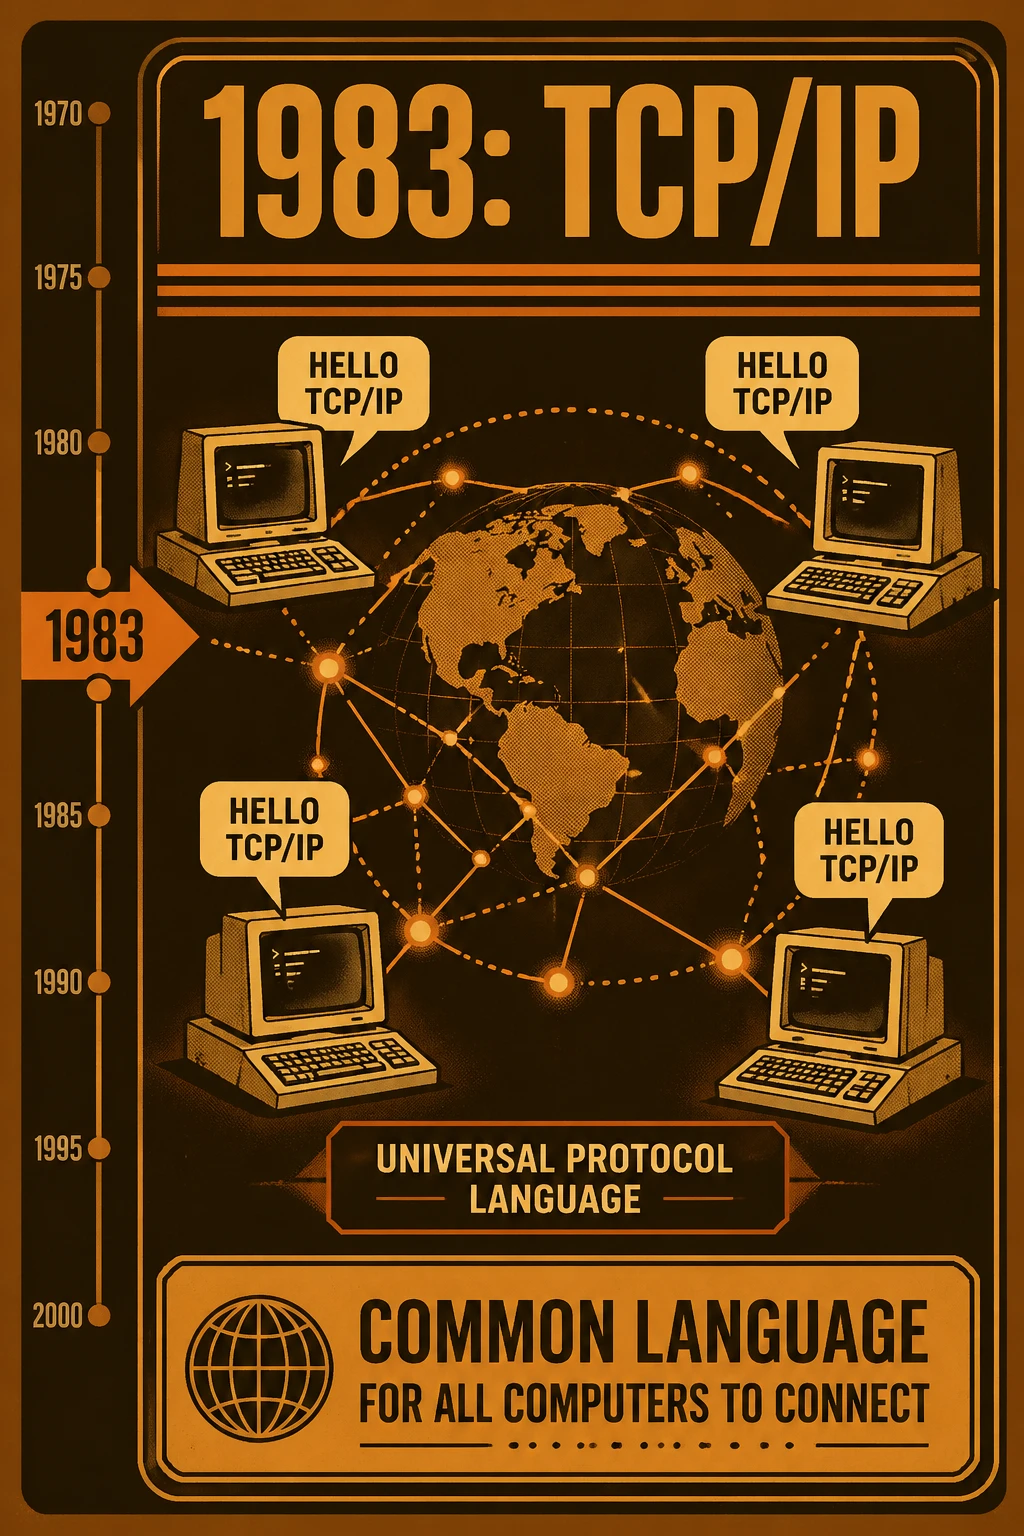
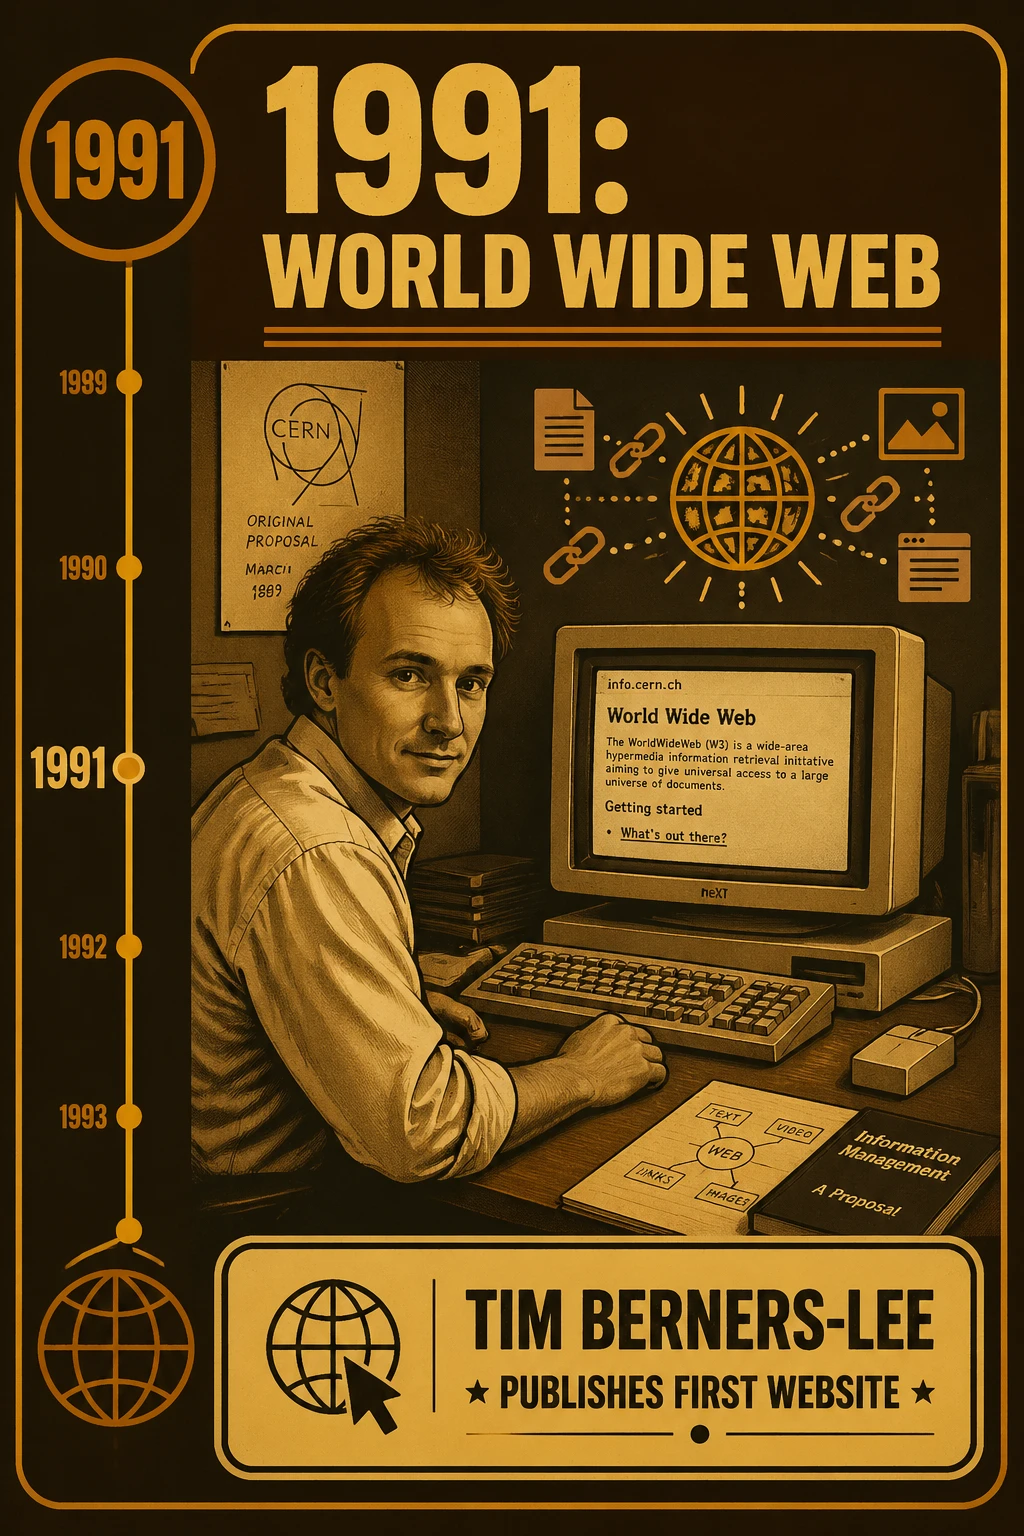
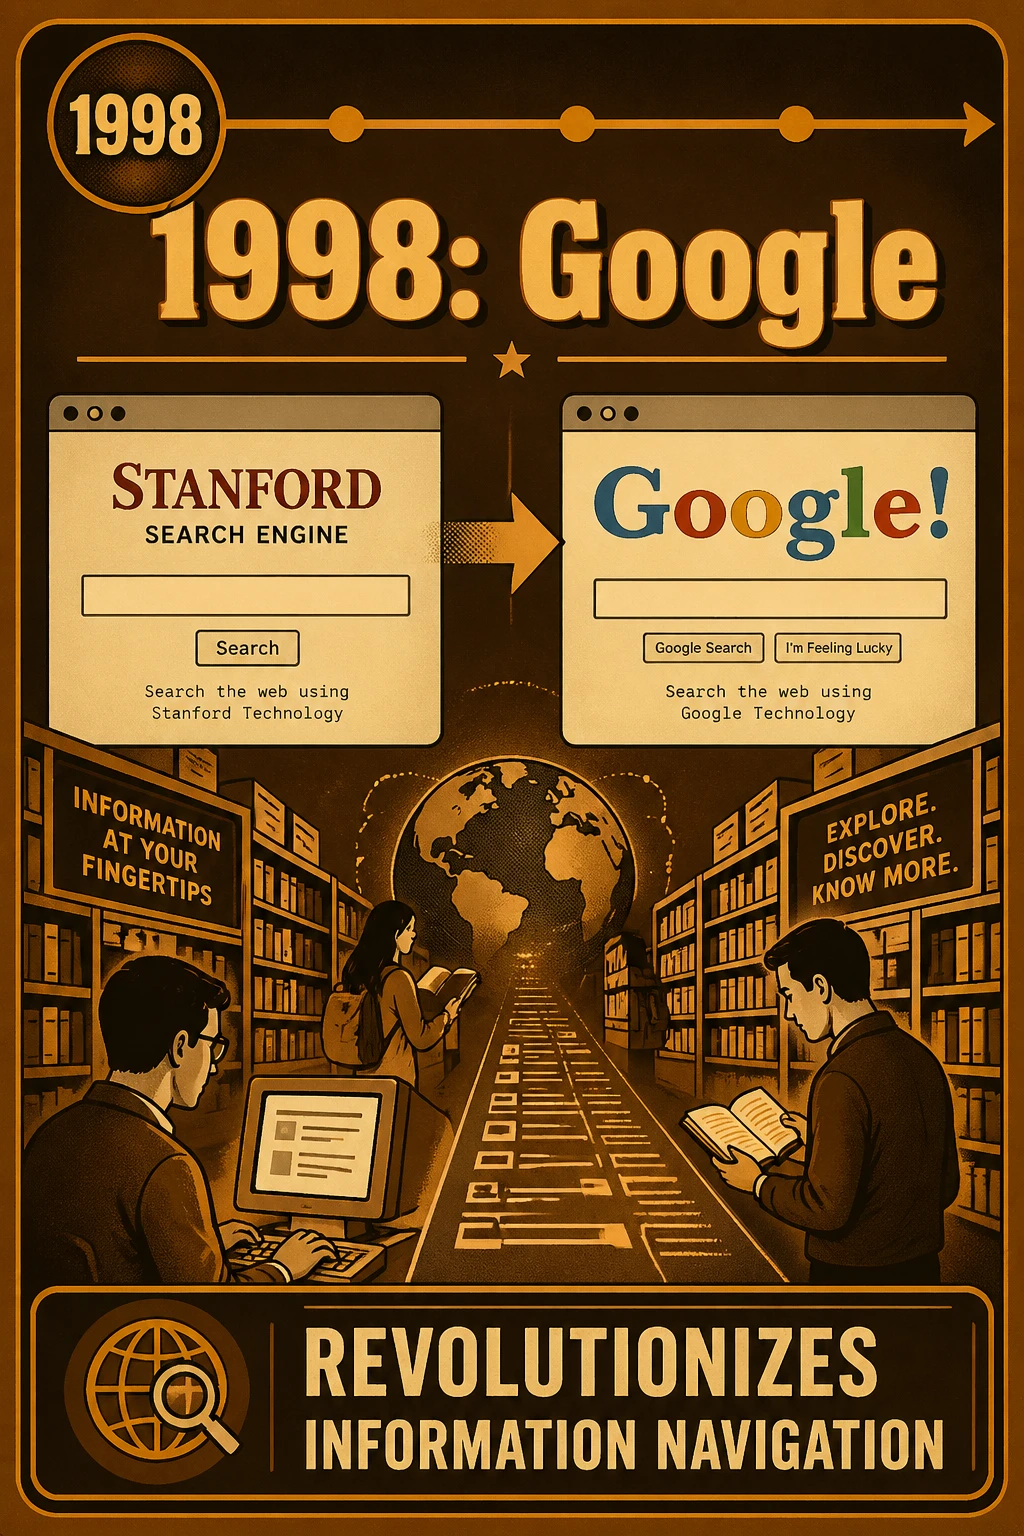
History of the Internet Milestones

minimal style illustration, grid layout, forest green and off-white palette colors. The card image shows a clean 2x2 grid: top cell with title 'What is Compound Interest?' in bold forest green sans-serif; bottom left cell with subtle exponential curve line graph in green; bottom right cell with key point text 'Earning interest on interest – exponential growth.' prominently rendered, surrounded by ample off-white space.minimal style illustration, grid layout, forest green and off-white palette colors. The card image shows a clean 2x2 grid: top cell with title 'The Rule of 72' in bold forest green sans-serif; bottom left cell with simple equation '72 ÷ 8% = 9 years' icon; bottom right cell with key point text '72 / annual rate = years to double money. 8% = 9 years.' prominently rendered, surrounded by ample off-white space.minimal style illustration, grid layout, forest green and off-white palette colors. The card image shows a clean 2x2 grid: top cell with title 'Start Early Wins' in bold forest green sans-serif; bottom left cell with timeline icons age 22 to 60 vs 32 to 60; bottom right cell with key point text '$200/mo from 22 > $400/mo from 32 at age 60.' prominently rendered, surrounded by ample off-white space.minimal style illustration, grid layout, forest green and off-white palette colors. The card image shows a clean 2x2 grid: top cell with title 'Frequency Matters' in bold forest green sans-serif; bottom left cell with three stacked bars daily/monthly/annual in green shades; bottom right cell with key point text 'Daily compounding > monthly > annual.' prominently rendered, surrounded by ample off-white space.
GPT Image 2

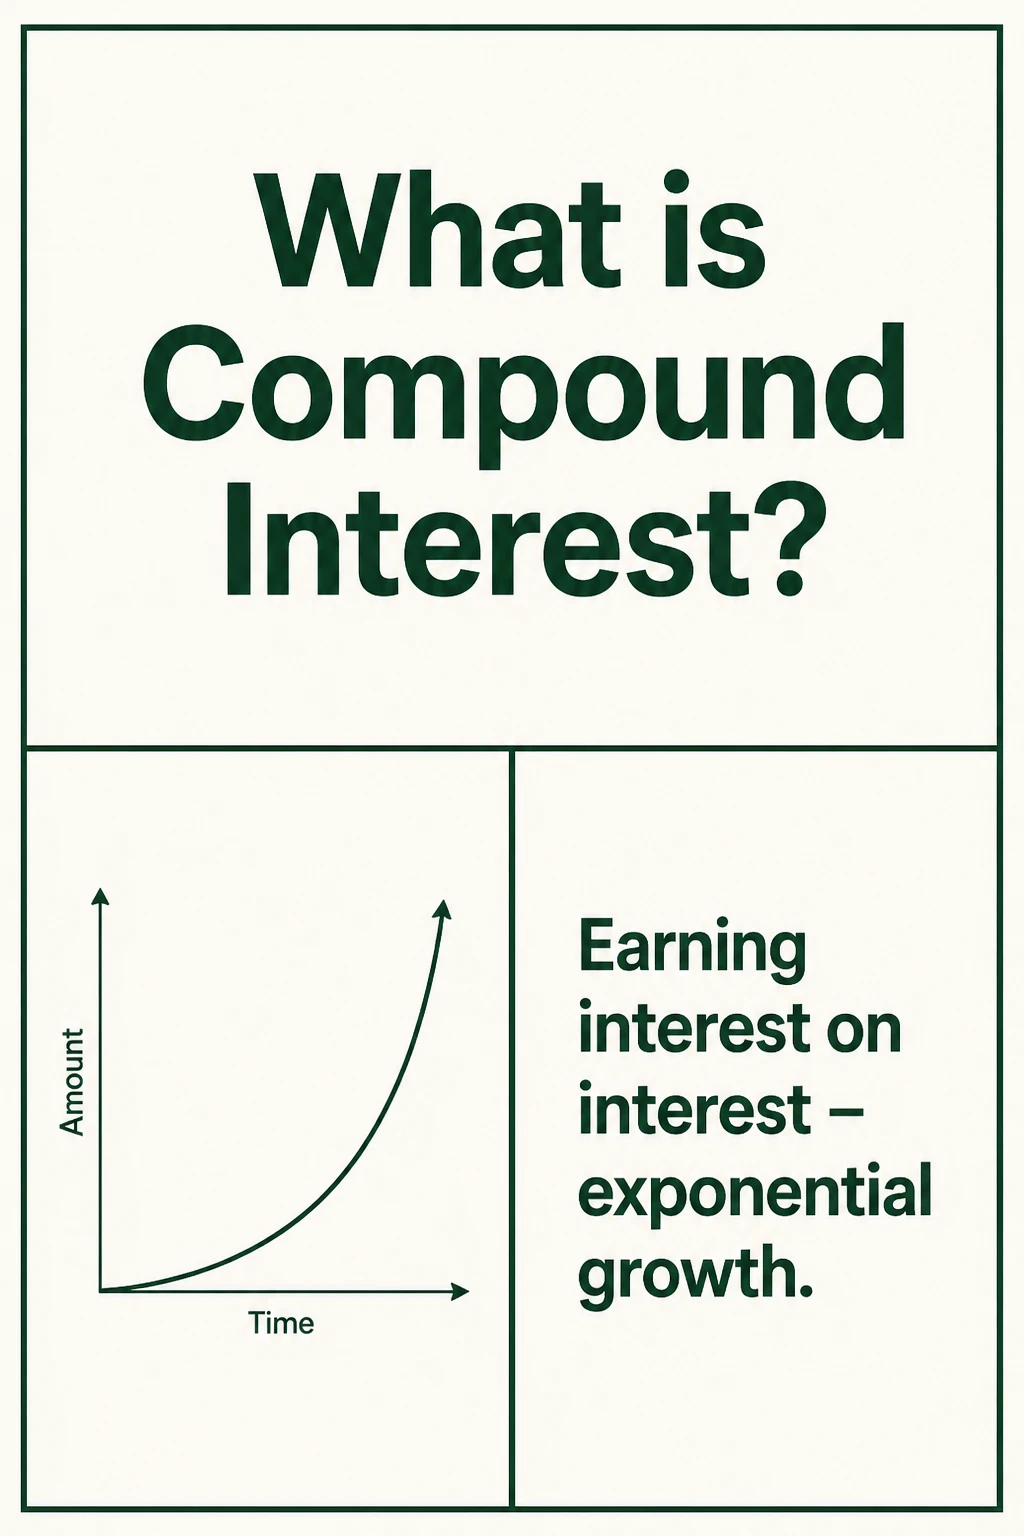
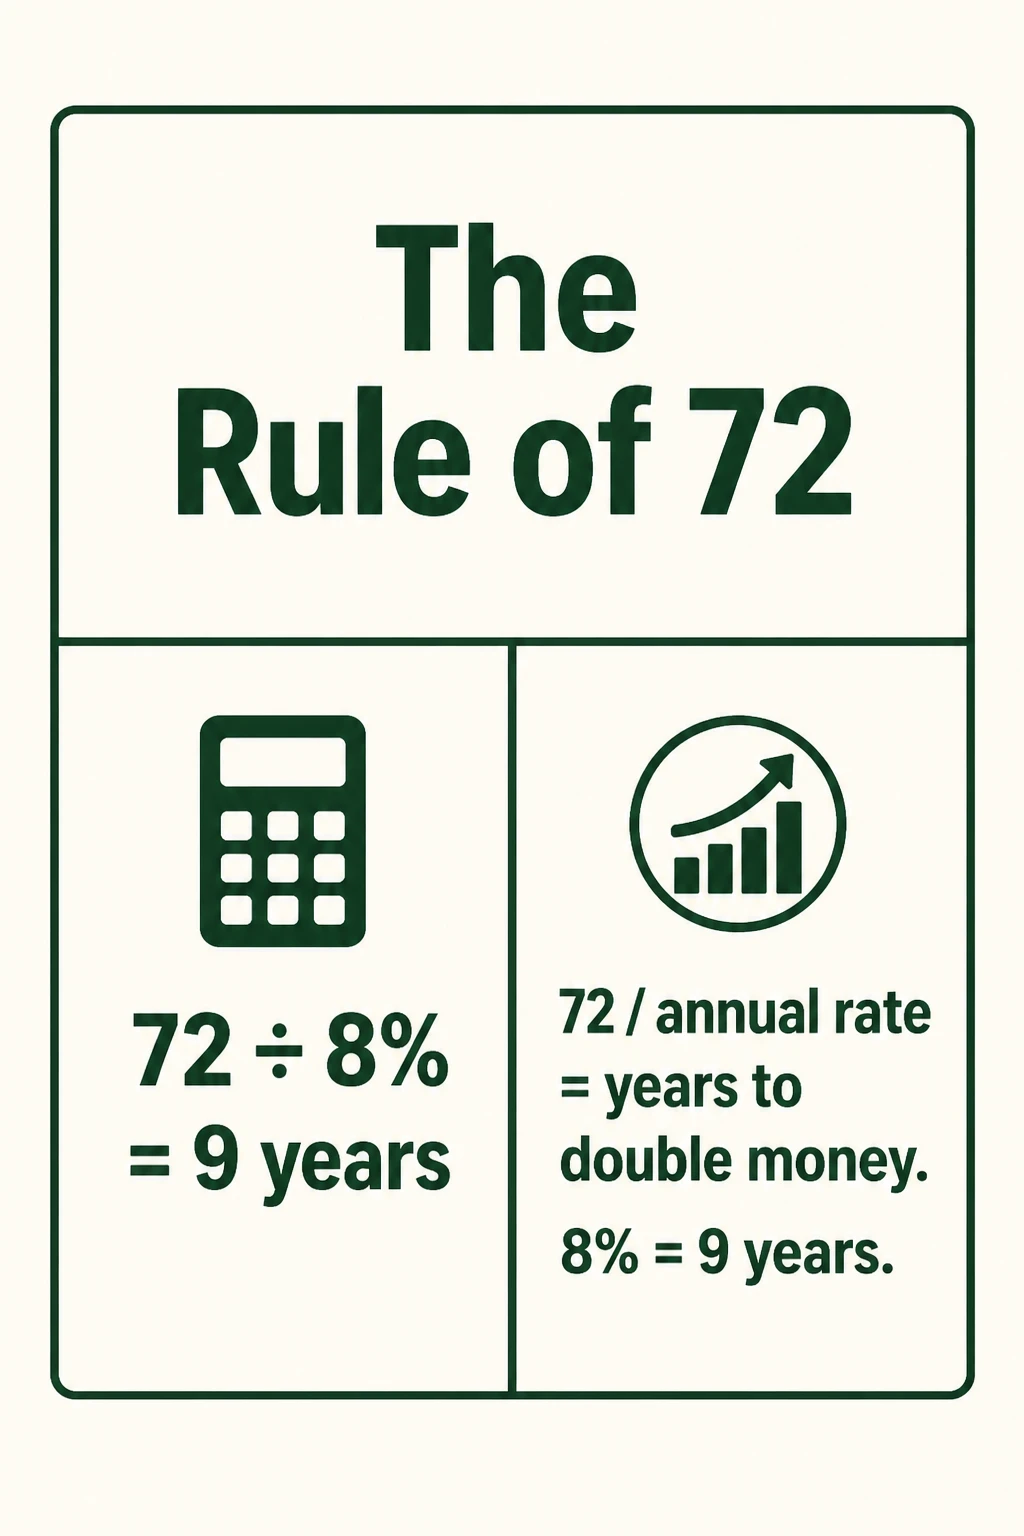
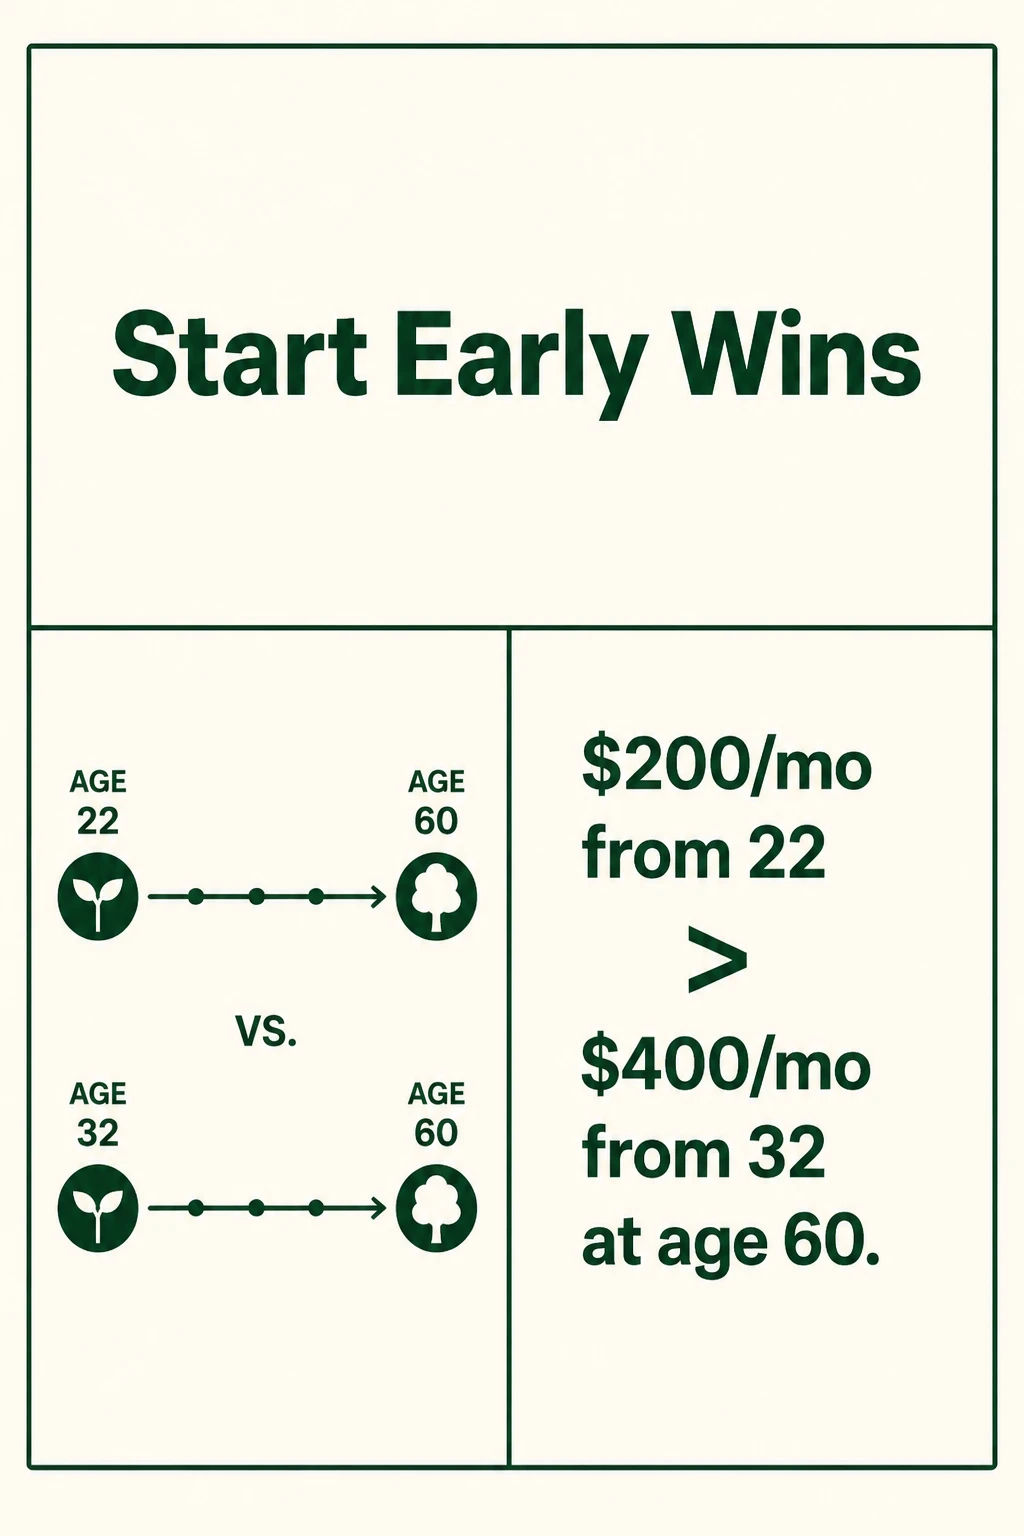
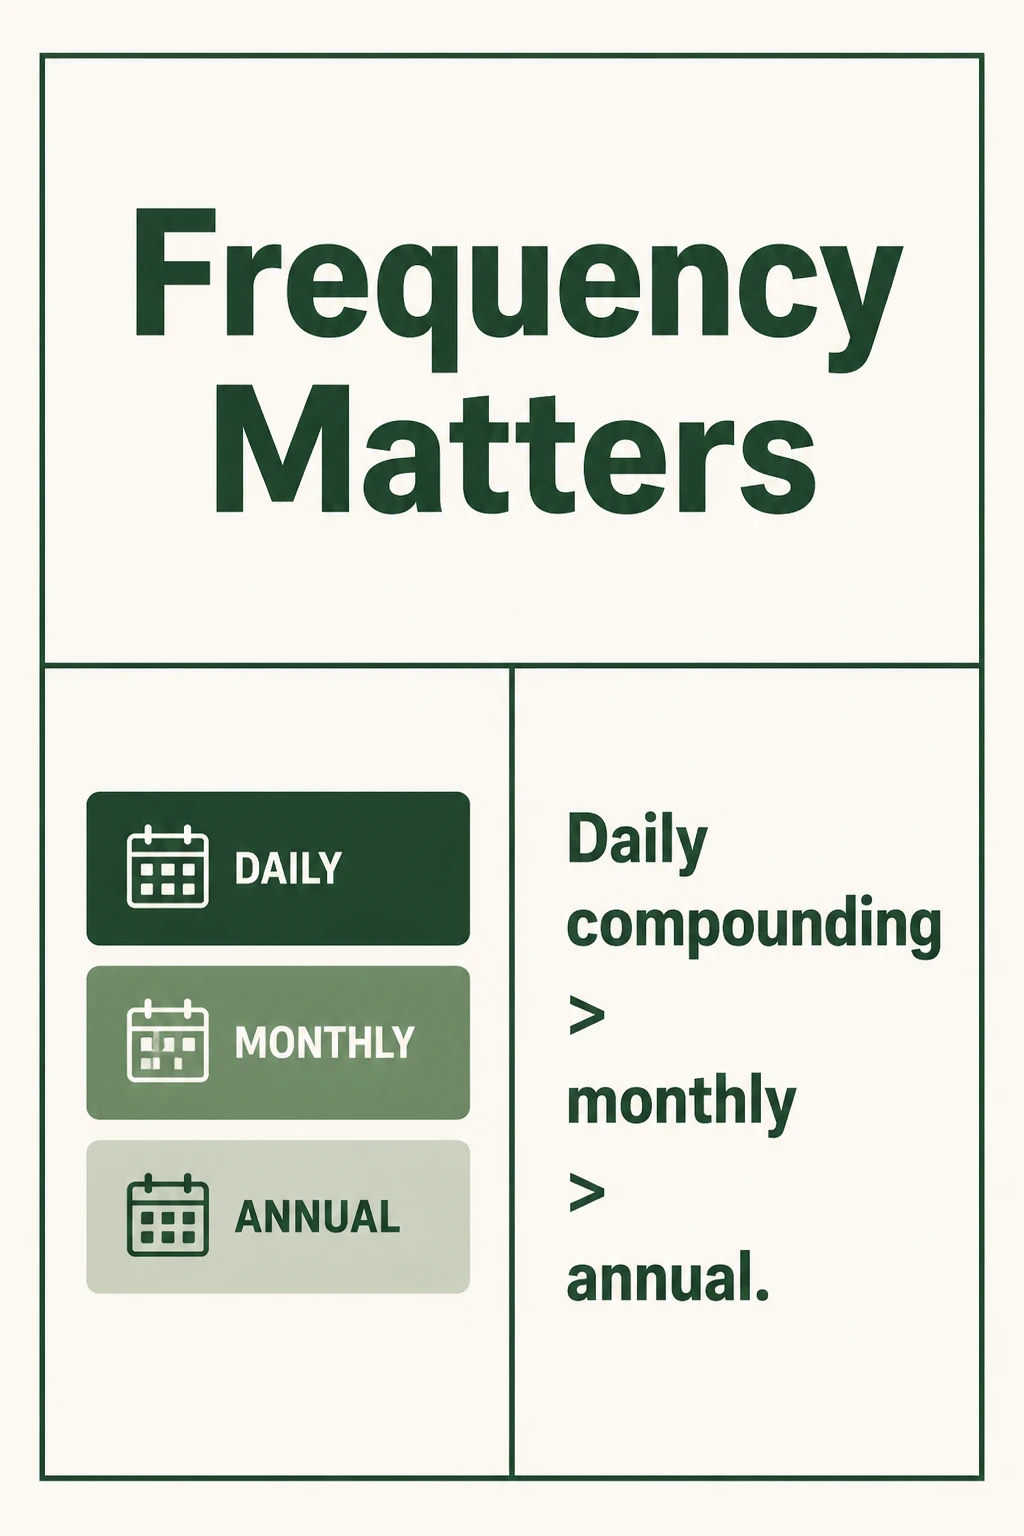
Compound Interest Essentials

bold style illustration, comparison layout, electric blue and vivid yellow palette colors. The card image shows a split screen with Python snake icon on electric blue left side dominating data/AI icons, JavaScript browser icon on vivid yellow right side with web/app icons, title 'Purpose' in massive bold electric blue font at top, key point text split across sides in large contrasting typographybold style illustration, comparison layout, electric blue and vivid yellow palette colors. The card image shows Python code snippet with clean indentation on electric blue left, JavaScript code with curly braces on vivid yellow right, title 'Syntax' in massive bold electric blue font at top, key point text split across sides in large contrasting typographybold style illustration, comparison layout, electric blue and vivid yellow palette colors. The card image shows speedometer with JS ahead on vivid yellow right for I/O, Python boosted by math icons on electric blue left, title 'Performance' in massive bold electric blue font at top, key point text split across sides in large contrasting typographybold style illustration, comparison layout, electric blue and vivid yellow palette colors. The card image shows package icons exploding from pip/Jupyter on electric blue left vs npm massive library on vivid yellow right, title 'Ecosystem' in massive bold electric blue font at top, key point text split across sides in large contrasting typography
GPT Image 2

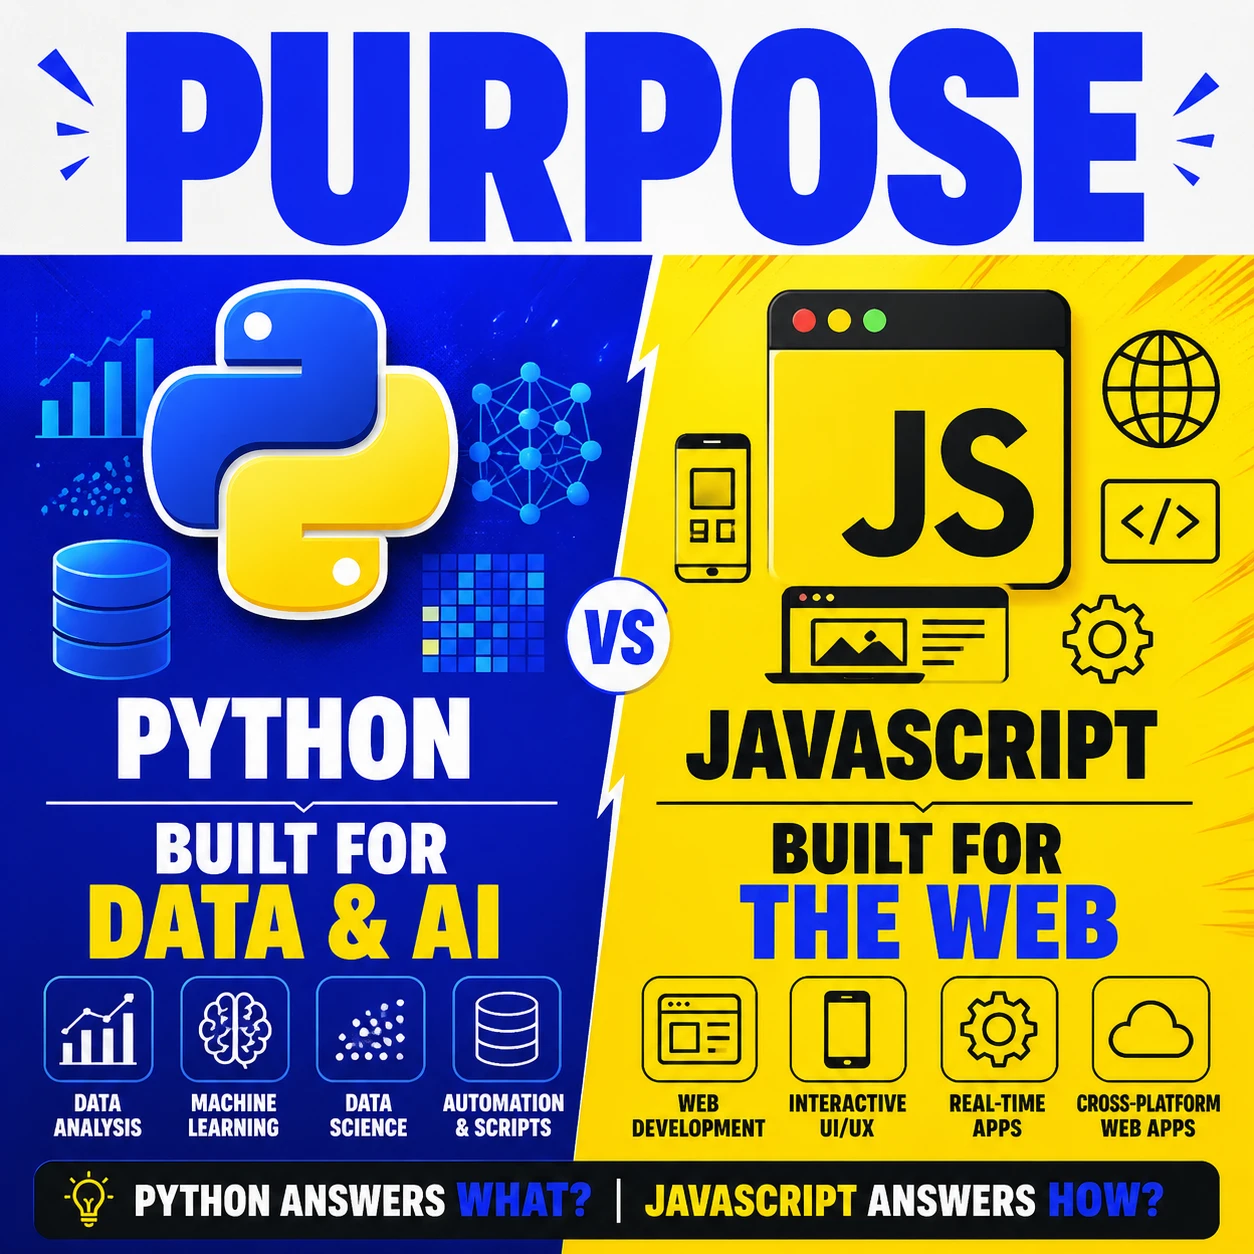
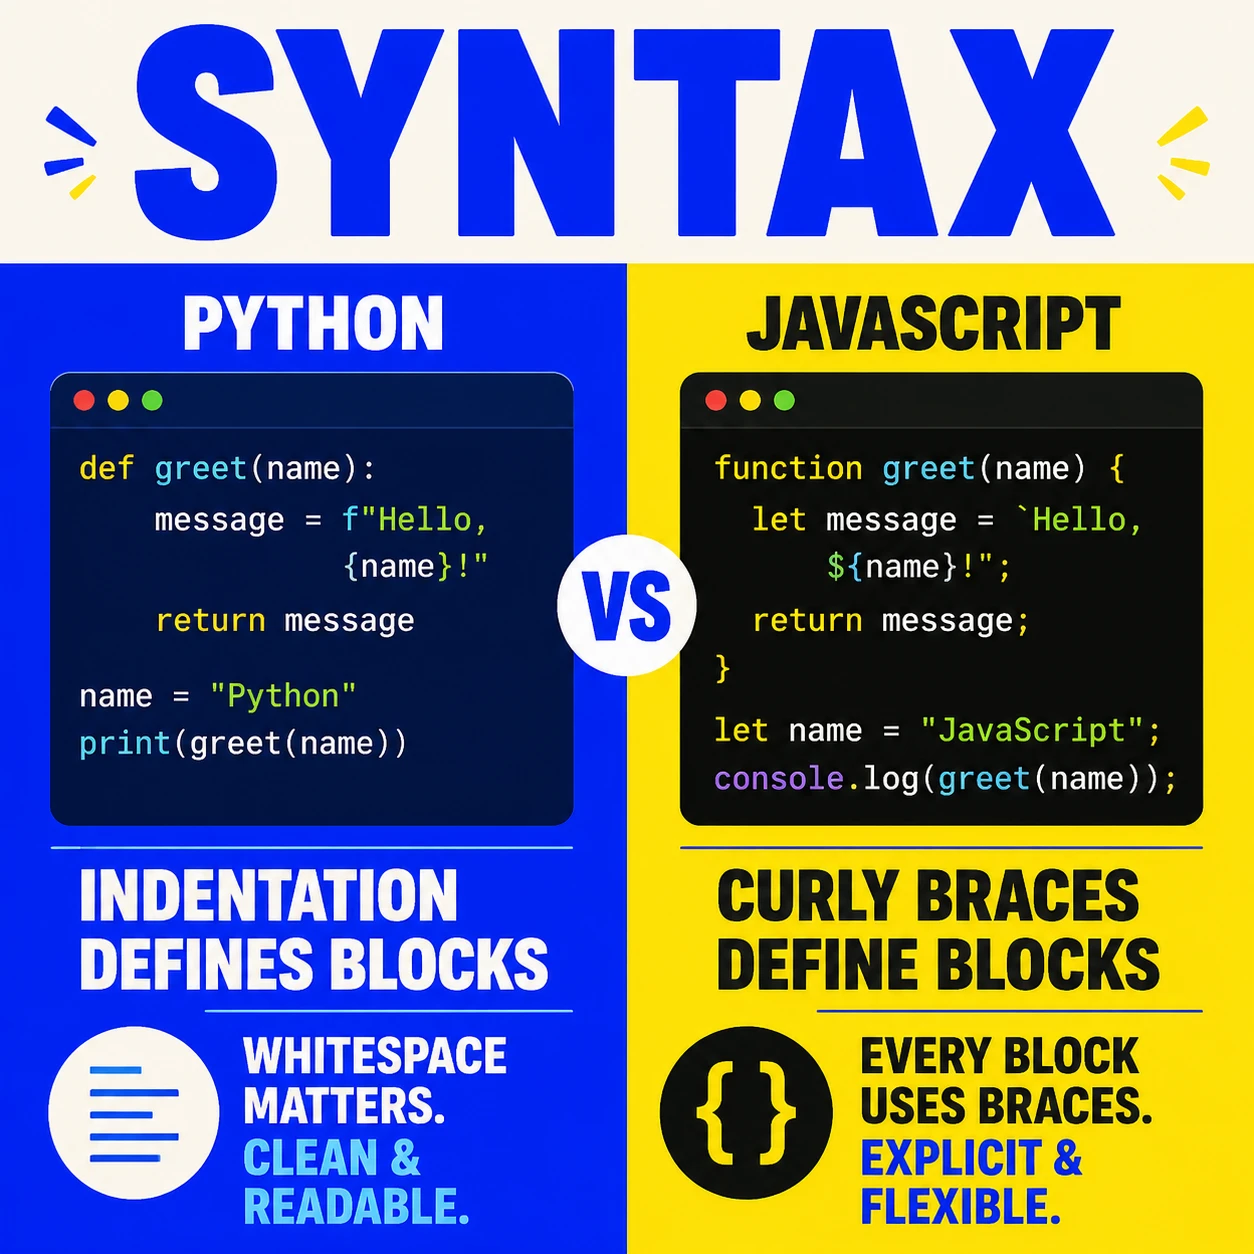
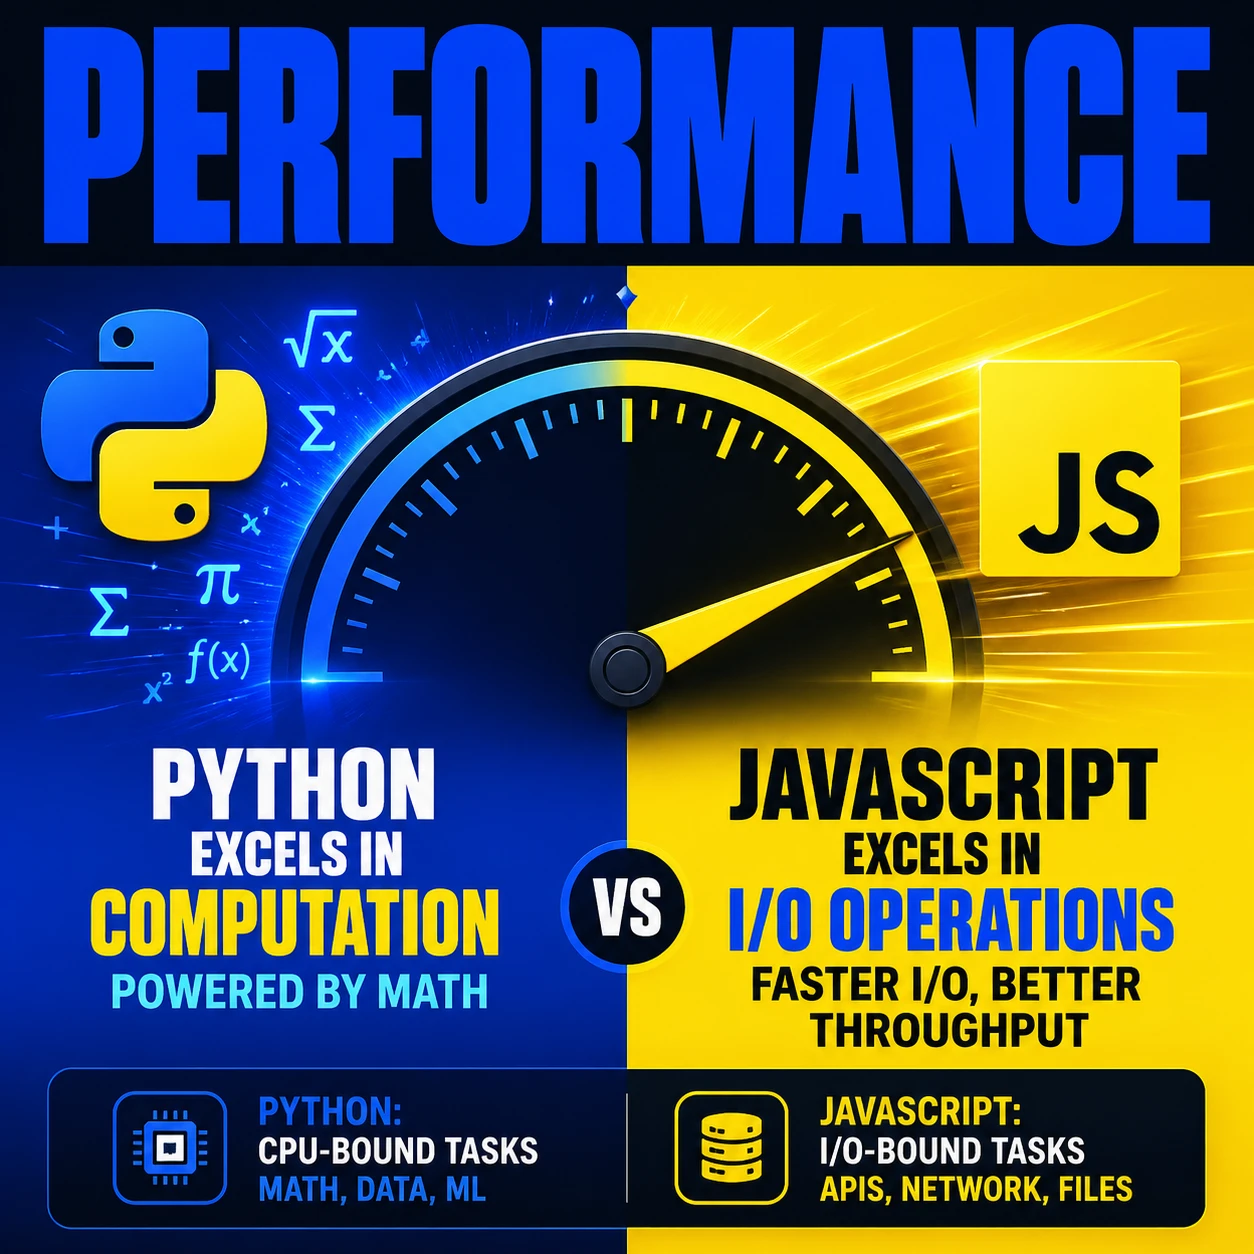
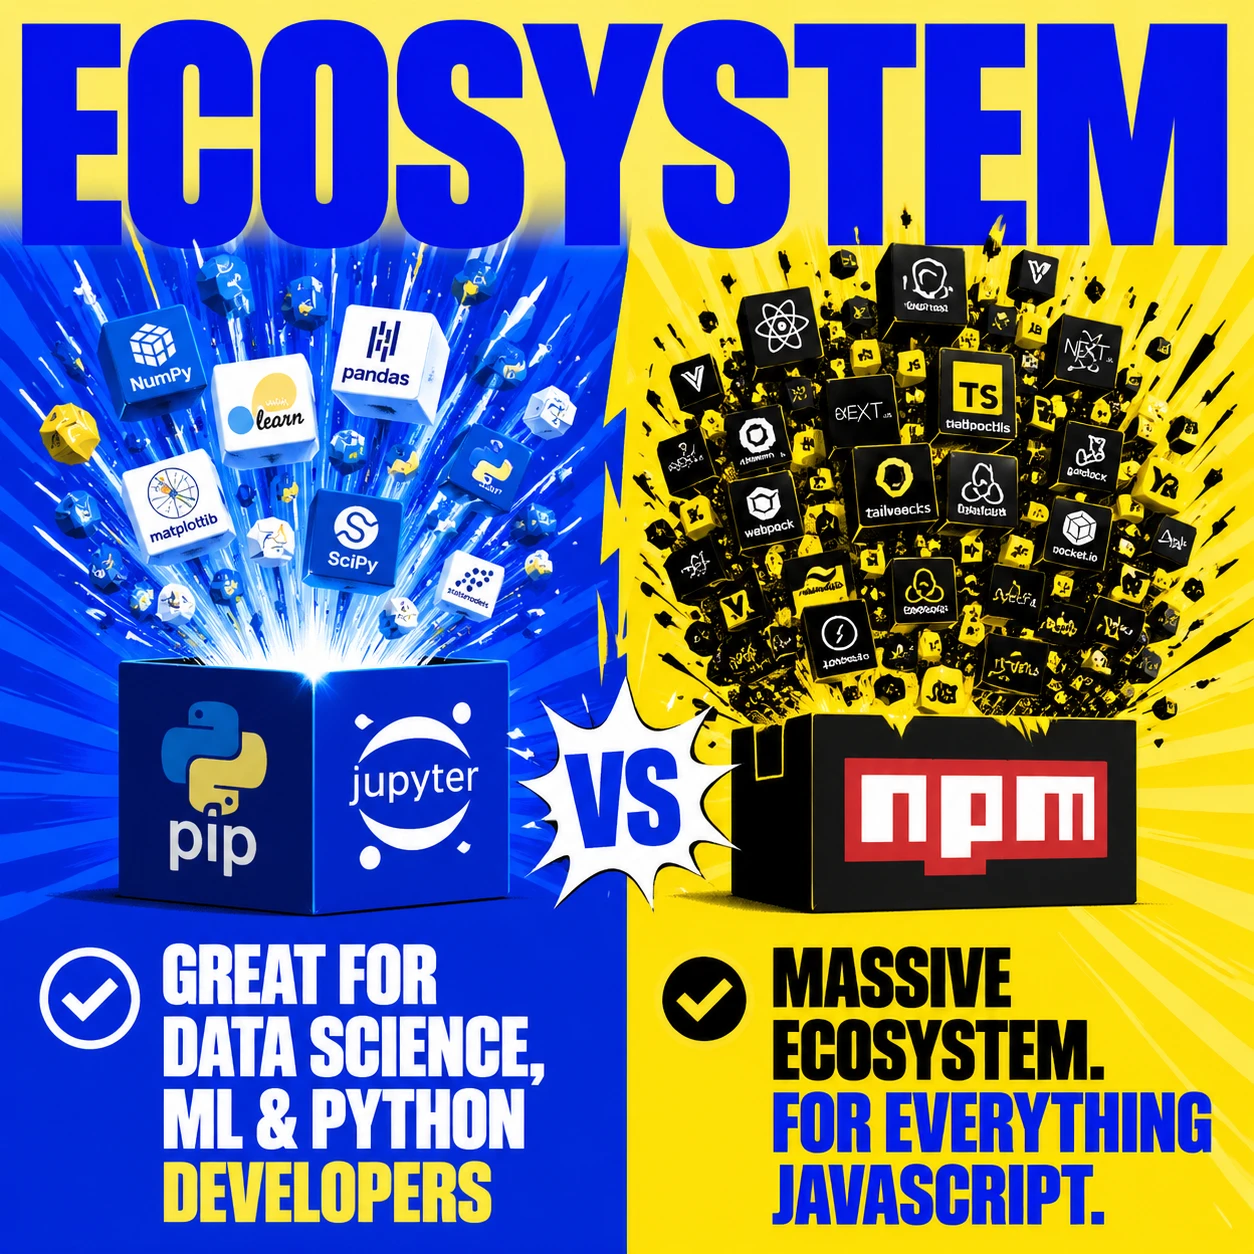
Python vs JavaScript Comparison

study-notes style illustration, two_column layout, yellow highlighter and lined white palette colors. The card image shows a realistic photo of lined white paper with handwritten blue pen notes, left column has title 'Spaced Repetition' in bold underlined handwriting with a doodled calendar icon highlighted in yellow, right column features the key point text prominently written and highlighted in yellow with spaced review arrows.study-notes style illustration, two_column layout, yellow highlighter and lined white palette colors. The card image shows a realistic photo of lined white paper with handwritten blue pen notes, left column has title 'Active Recall' in bold underlined handwriting with a doodled brain quiz icon highlighted in yellow, right column features the key point text prominently written and highlighted in yellow with a '2x' badge.study-notes style illustration, two_column layout, yellow highlighter and lined white palette colors. The card image shows a realistic photo of lined white paper with handwritten blue pen notes, left column has title 'Feynman Technique' in bold underlined handwriting with a doodled child listening icon highlighted in yellow, right column features the key point text prominently written and highlighted in yellow.study-notes style illustration, two_column layout, yellow highlighter and lined white palette colors. The card image shows a realistic photo of lined white paper with handwritten blue pen notes, left column has title 'Interleaving' in bold underlined handwriting with doodled mixed puzzle pieces icon highlighted in yellow, right column features the key point text prominently written and highlighted in yellow.
GPT Image 2

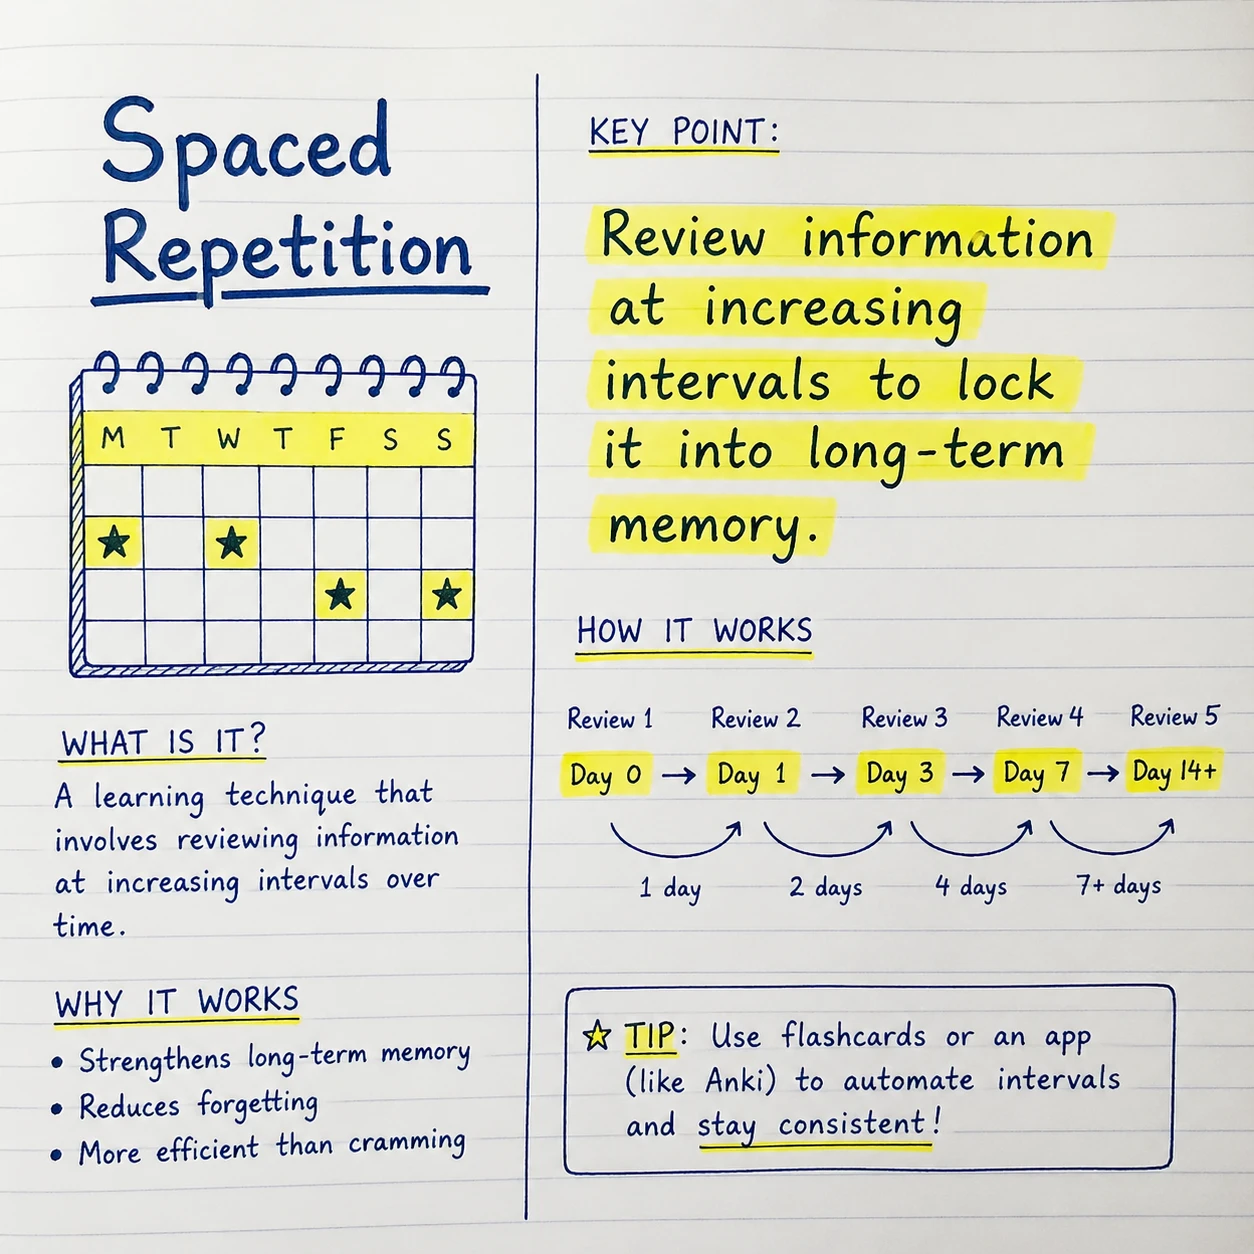
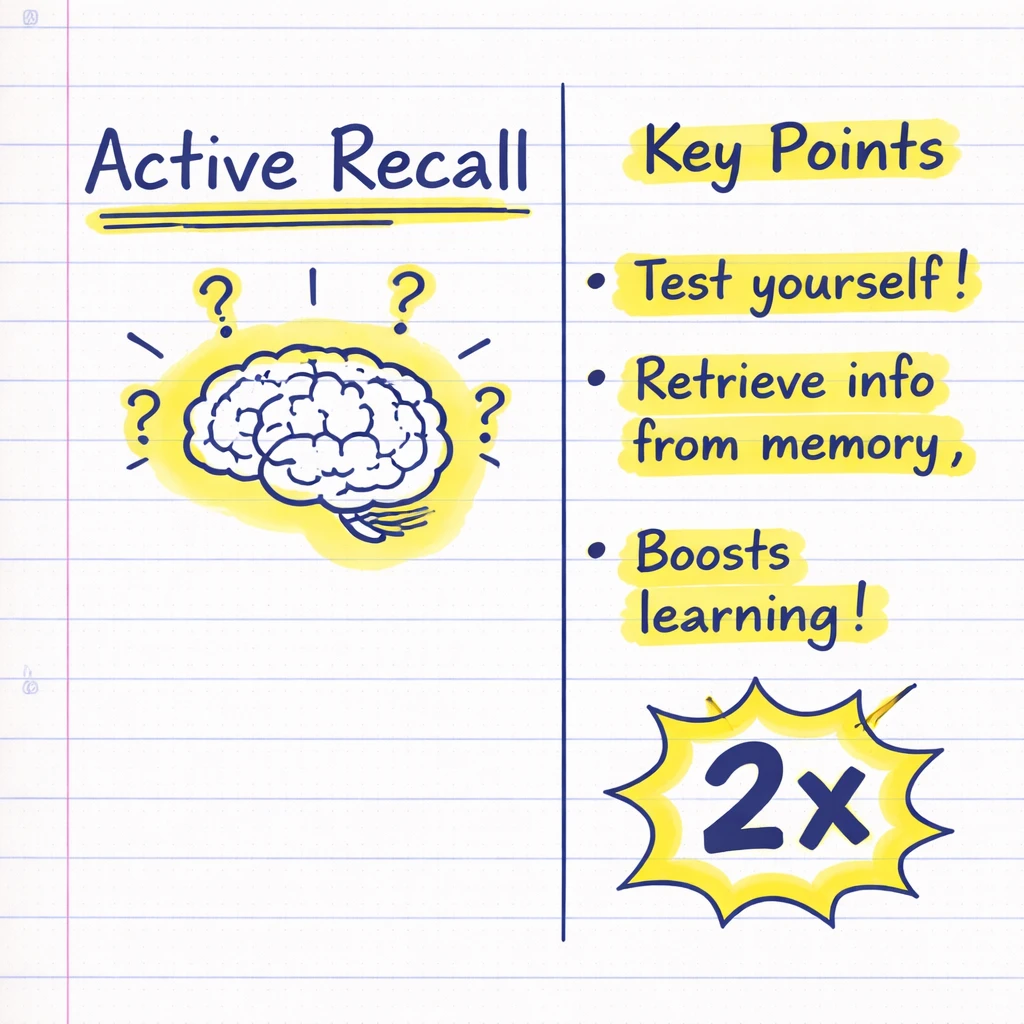
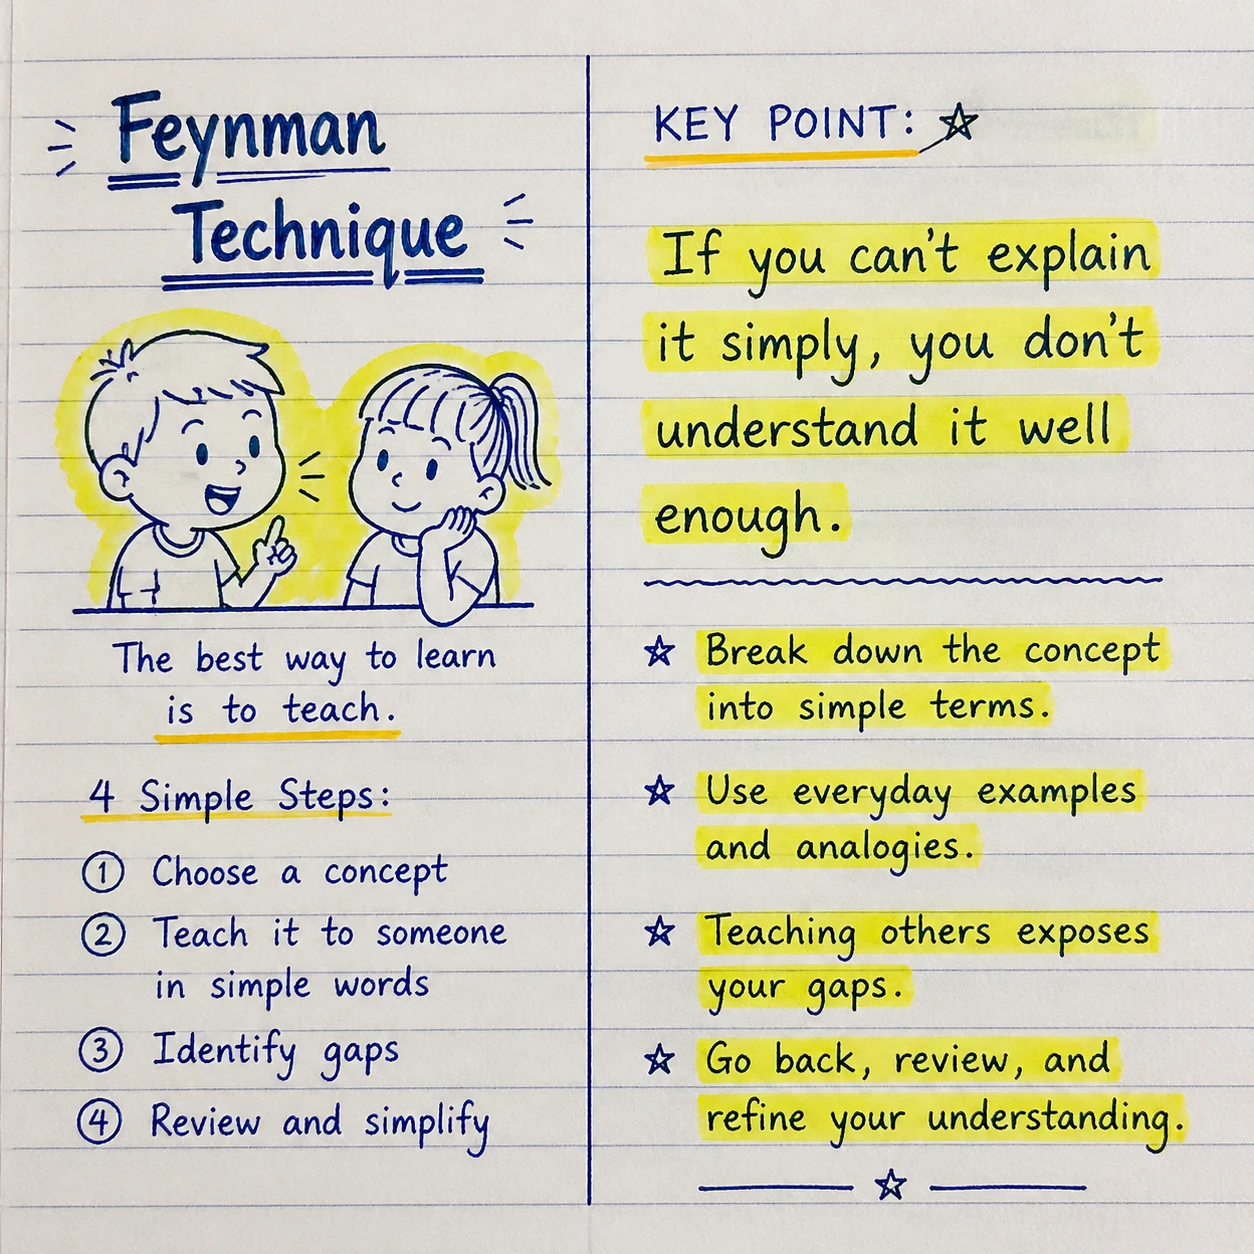
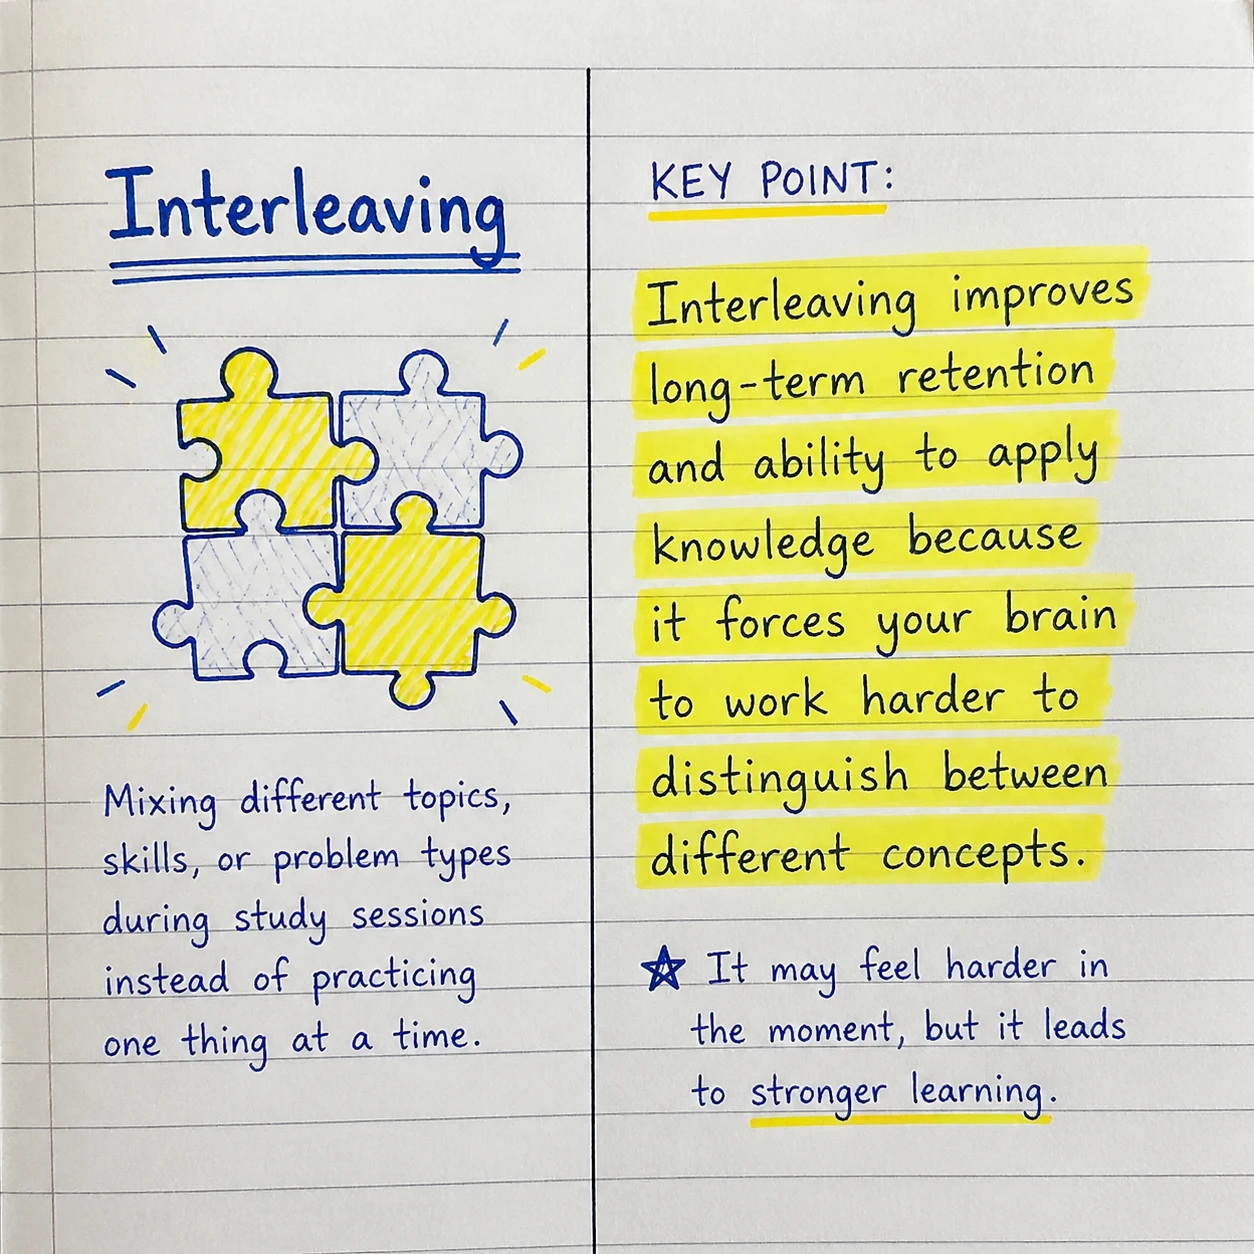
Science of Learning: Study Smarter

功能

智能卡片系列

AI 將您的內容拆解為聚焦且易於分享的卡片,每張卡片傳達一個明確的訊息。

12 種視覺風格

可愛風、Notion 風、黑板風、手繪筆記風等。每種風格都能一致地呈現文字和視覺效果。

並行生成

所有卡片同時生成,幾分鐘內即可完成整套製作。

工作原理

1

貼上您的內容

貼上文章、筆記或任何您想轉換為卡片的文字。

2

選擇風格與佈局

選擇適合您受眾的視覺風格和佈局。

3

生成並分享

AI 可建立精美的卡片系列,隨時可發佈。

常見問題

什麼樣的內容效果最好?
文章、教學、關鍵要點、知識總結——任何結構化資訊均可。
我可以生成多少張卡片?
每組 1 到 10 張卡片。
這需要消耗多少積分?
AI 規劃需 1 點積分 + 每張卡片需 5 點積分(使用 FLUX 模型)。